Visualisation
Accomodations & Prices
In general, there are three options to choose from when booking an Airbnb. The most demanded type of accommodation is a full apartment or house. This means that the owner is temporarily absent. The second and the third option include that the owner will remain in the property during the stay. The two possibilities distinguish between either a shared room or a separate, private room. It can be expected that the level of privacy an accommodation can offer will have an effect on the price of sharing economy based accommodation.
Let us have a first look at our data: We can see, from the first look, that Shared Rooms are not the most popular way of using Airbnb in Copenhagen. With only 17 listings, I will drop them from the further analysis.
| Accomodation | Frequency |
|---|---|
| Entire home/apt | 6318 |
| Private room | 1199 |
| Shared room | 17 |
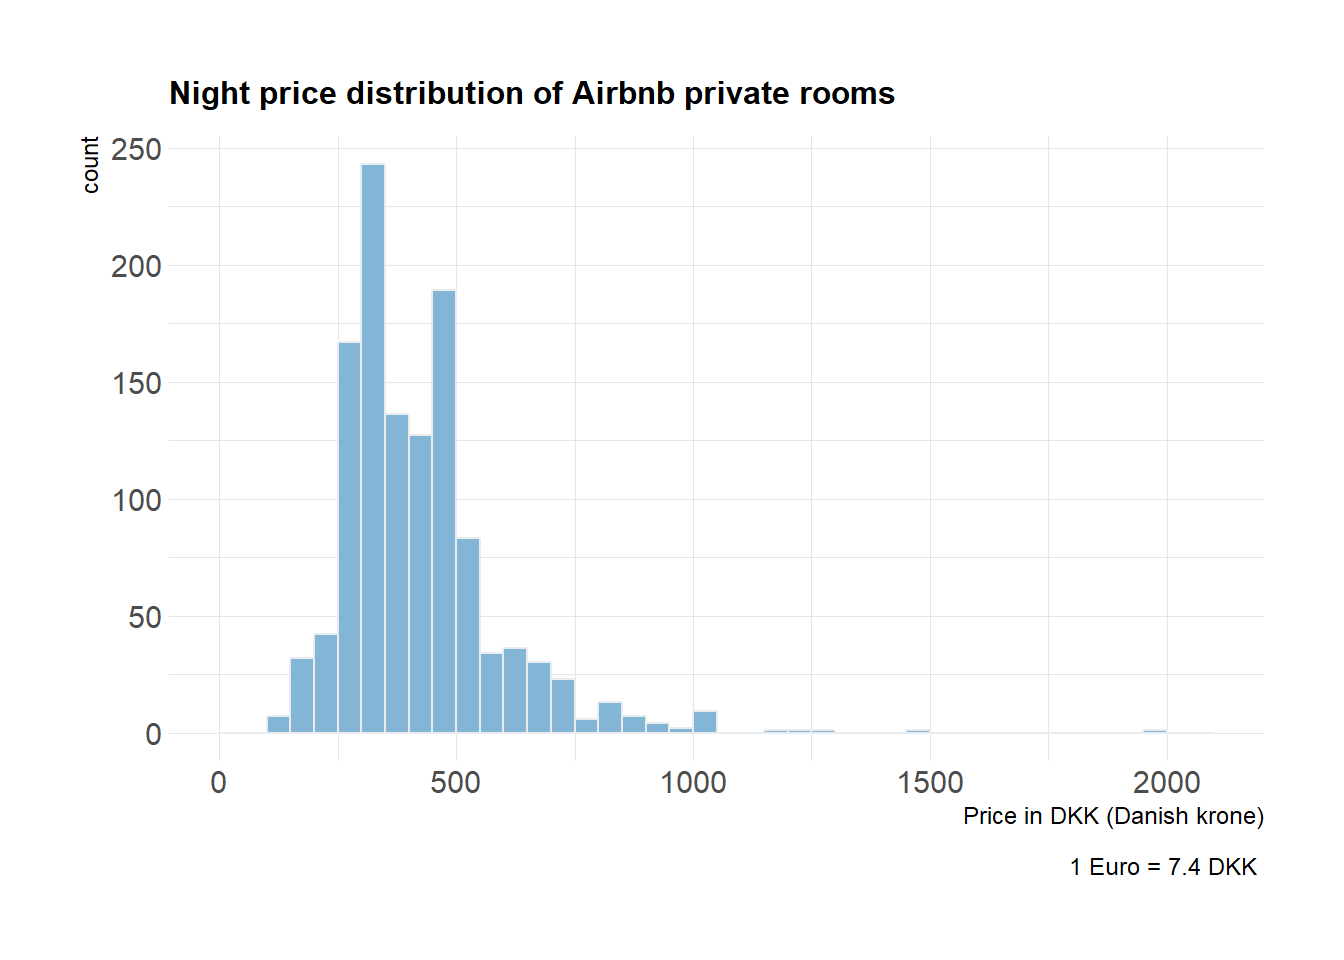
Now we want to look at the night price distribution of Airbnb listings, one for the Airbnb apartments (you have the whole apartment for yourself) and one for AirBnB private rooms (you have your own room, but are sharing the apartment with the host). The data frame, as already shown in the descriptive analysis section, is short of observations on shared rooms which is why they are no further considered here.
In addition, using the plotly package, I created an interactive bar plot of the number of listings sorted after the neighborhoods in Copenhagen. From the first look, we can see that Nørrebro, Vesterbro, Frederiksberg, and Østerbro hosts the most Airbnb listings. This is not completely surprising as these neighborhoods are very central and popular.
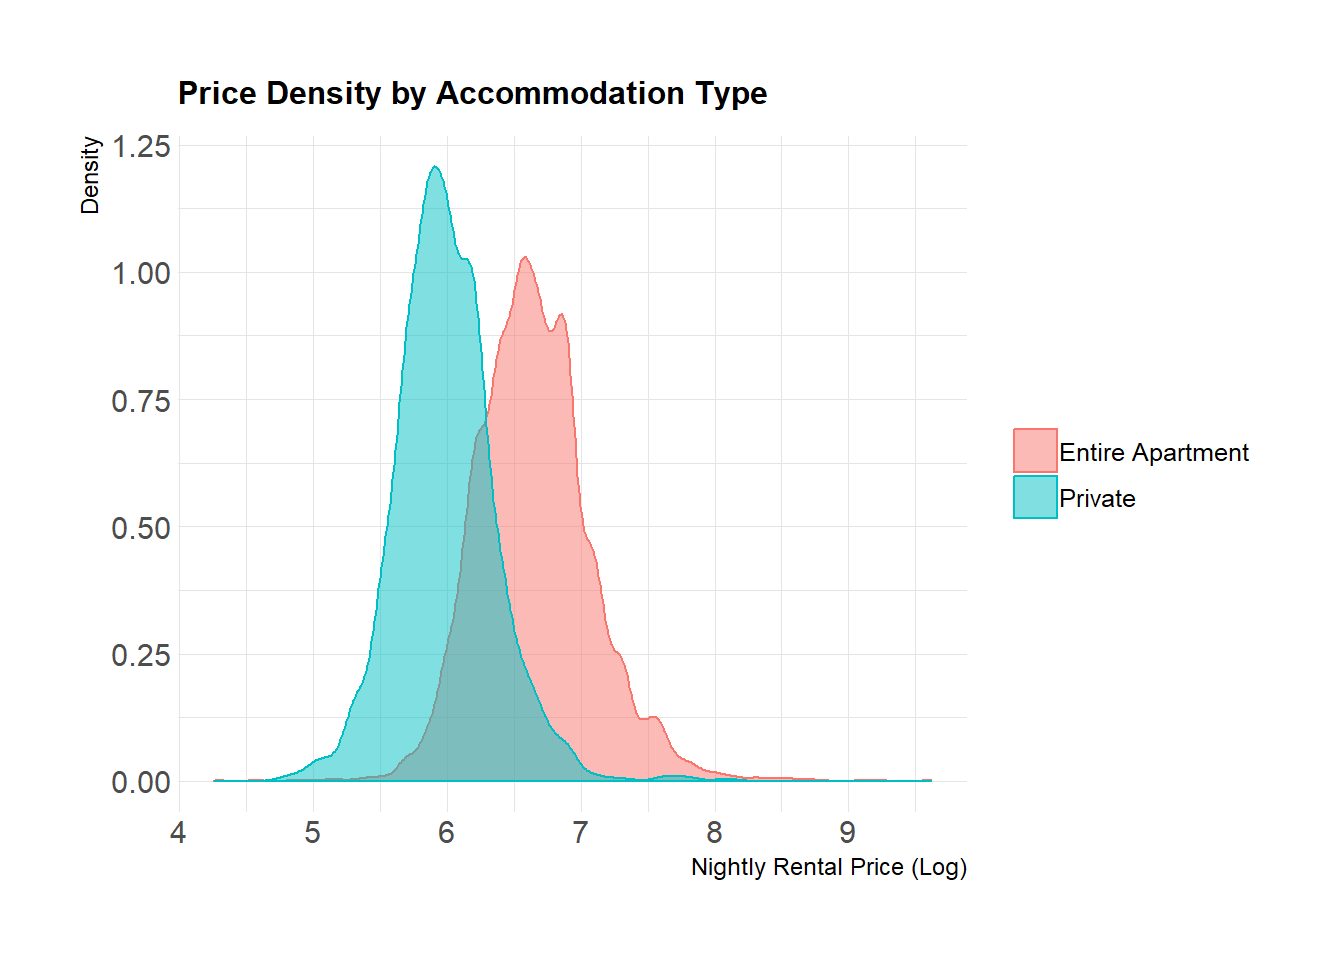
We will now turn to the price distribution. The first graph shows the range of night price distribution of Airbnb apartments and the second histogram displays the same for private rooms. The trend that private rooms are cheaper than apartments is clearly evident in the graphs.


Distance
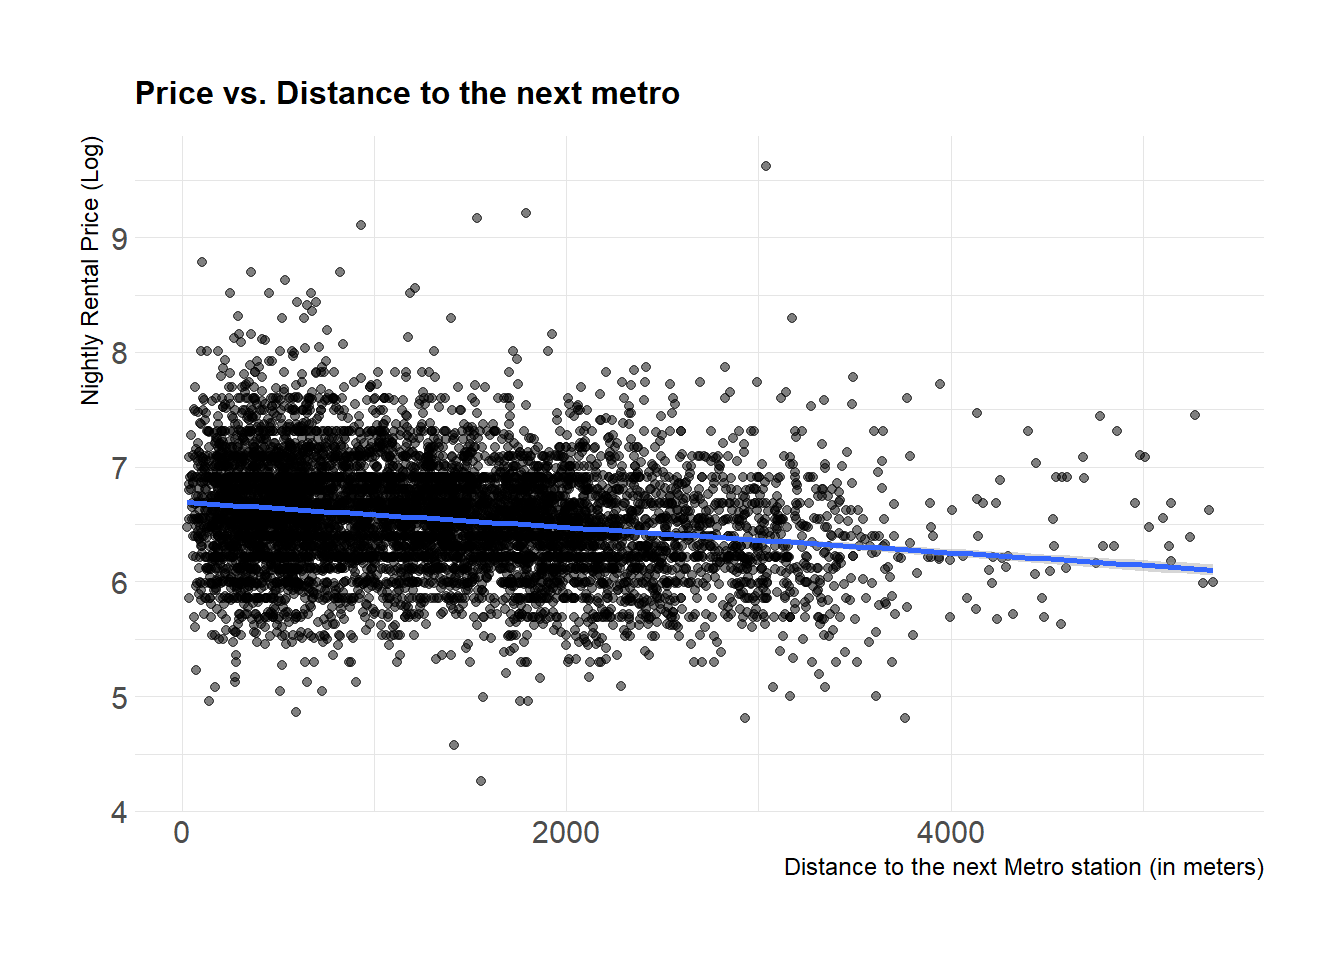
One of the main questions raised in this work is the influence of distance to the metro stations on the price of the listings.


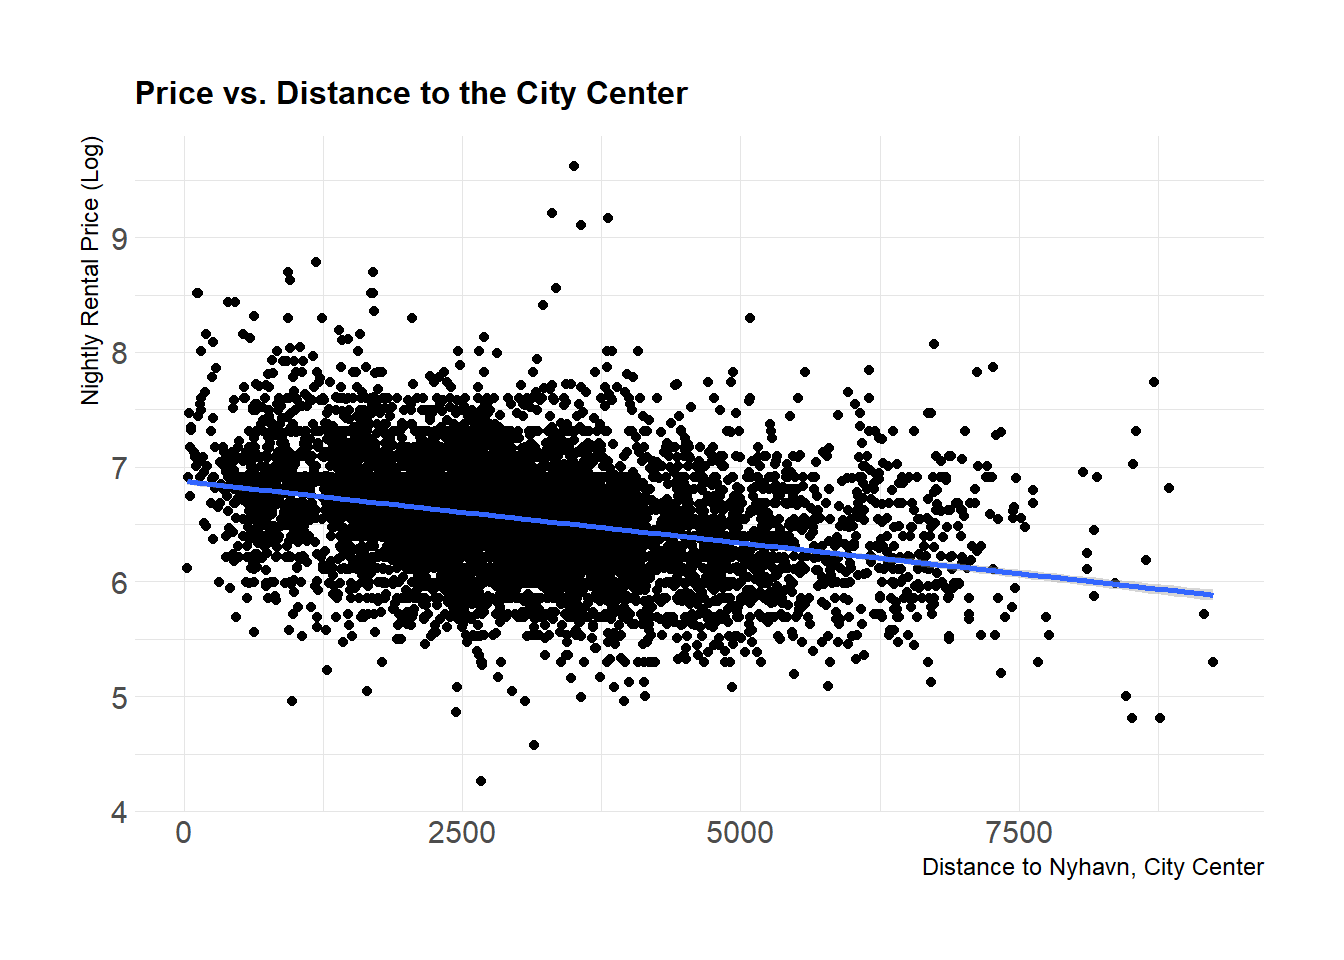
It seems that, from the first glance, that the distance to the next metro has almost no effect. While the distance to the city center works, as we can see a lower price the more away the listing is located. My first thought was that perhaps people who stay in apartments that are in walking distance to the city center will not need the metro as a way of transportation. Thus, I made the same calculations and plots for apartments which are at least 2km away from Nyhavn. However, even if I extend this to apartments located at least 5km away from the city center, the picture still showed me no trend at all. At this point, I had to conclude that the distance to the next metro does not influence the price significantly. Nevertheless, I calculated the median price per night for two cases: In both cases, the apartment is at least located 3.5 km away from the city center. The first case reports the median price for a distance to the next metro below 250m and the other case above 250m.
## # A tibble: 1 x 1
##   median
##    <dbl>
## 1    698
## # A tibble: 1 x 1
## median
## <dbl>
## 1 561I will return to this point later in the regression part.
Mapping
We can see on the map how the Airbnb listings are distributed over the whole city. Simultaneously, the blue-red dots represent the metro lines of Copenhagen. Both connect the east and western part with the city center which is located near Nørreport. One is going to the Airport (Lufthavn) and the other travels to Vestamager. The blue pop-up shows the location of Nyhavn, a touristic hot spot in the center of the city. Between 1845 and 1864 and from 1871 to 1875 the famous Danish fairytale writer Hans Christian Andersen lived in houses located at Nyhavn.
Mapping the neighborhoods
The Neighbourhoods GEOJSON file contains geocoordinates of Copenhagen’s neighbourhoods which will enable us to visualise them on a map.